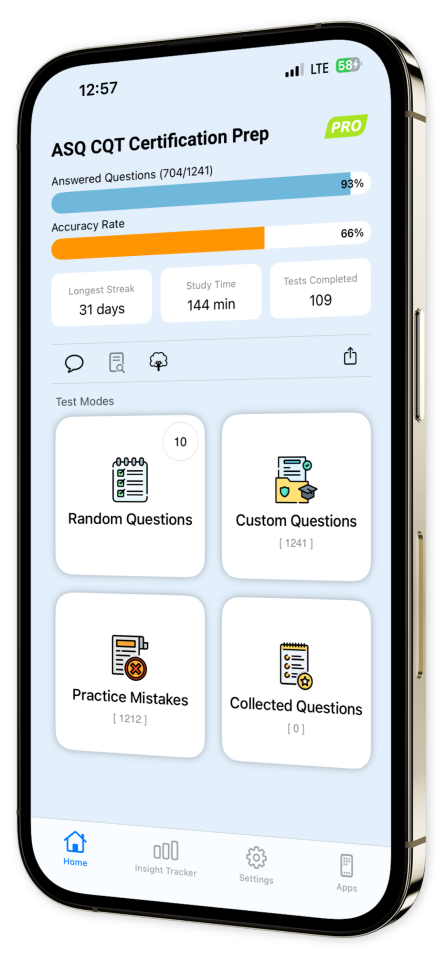
ASQ CQT Certification Prep iOS
Master your ASQ CQT exam preparation with ASQ CQT Certification Prep!
Our app is your ultimate companion for achieving success in the Certified Quality Technician (CQT) certification.
Engage with a rich array of practice questions that comprehensively cover all critical areas of the exam.
Each question is meticulously crafted with detailed explanations to enrich your understanding and enhance your skills.
Key Features:
Extensive Question Bank: Immerse yourself in hundreds of practice questions across vital topics, ensuring a well-rounded preparation.
In-Depth Explanations: Dive deep into each concept with detailed rationales, fortifying your learning and boosting retention.
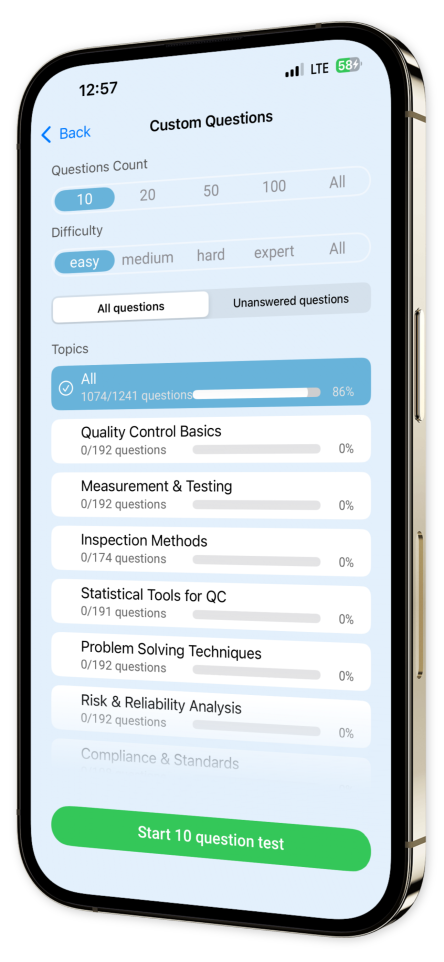
Custom Test Creation: Tailor your study sessions by crafting quizzes from specific topics and question types, pinpointing your focus where it matters most.
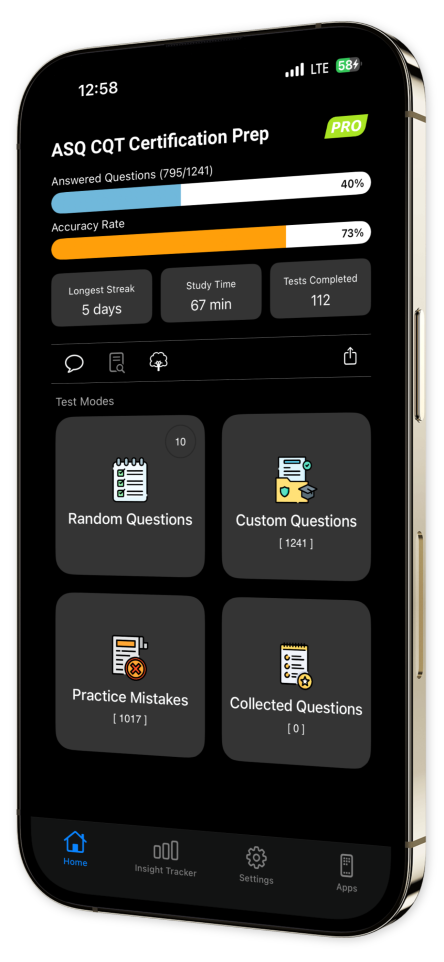
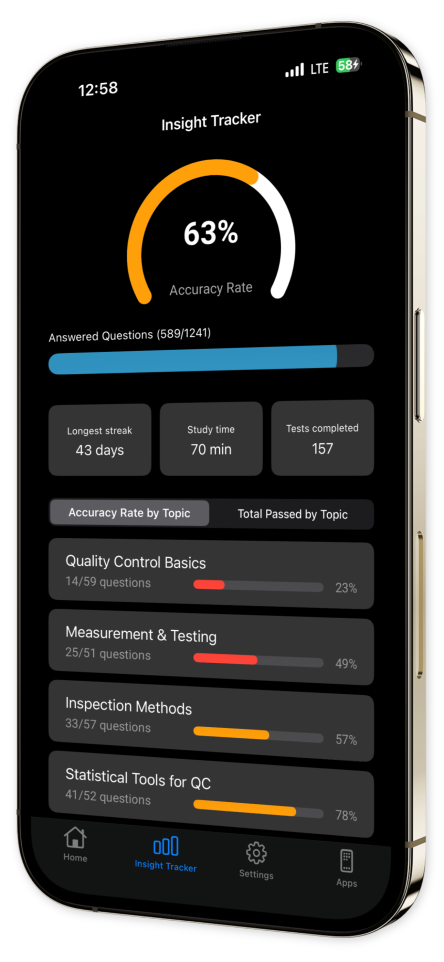
Progress Tracking: Monitor your advancement over time with our intuitive tracking features, allowing you to stay ahead of your goals.
Offline Access: Access your study material anytime, anywhere—even without an internet connection—ideal for on-the-go learning.
User-Friendly Interface: Navigate effortlessly through a sleek and intuitive design, keeping your focus on mastering the material without distractions.
Download ASQ CQT Certification Prep today and immerse yourself in an innovative approach to mastering your Certified Quality Technician certification!
Elevate your exam confidence and approach the ASQ CQT with renewed mastery and assurance.
Seize the opportunity to succeed and download now!

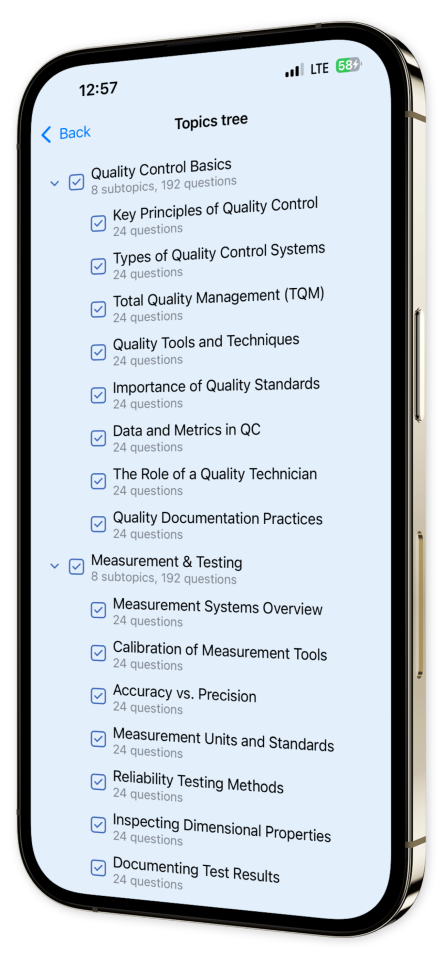
Content Overview
Explore a variety of topics covered in the app.
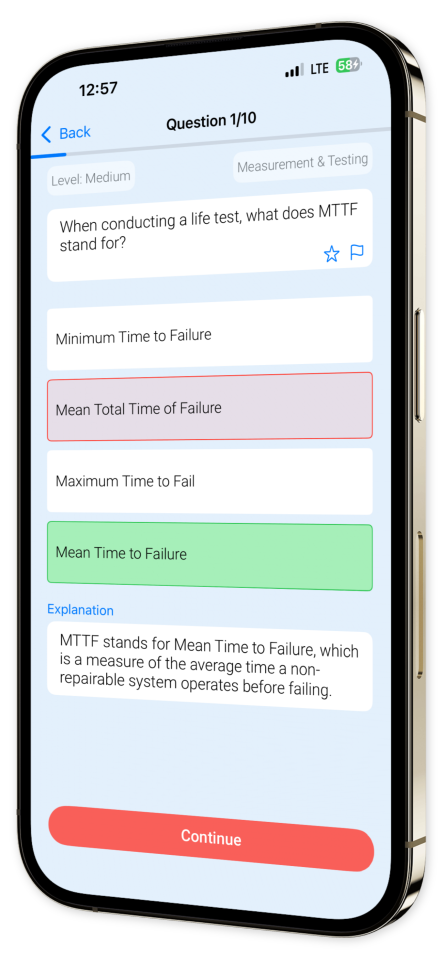
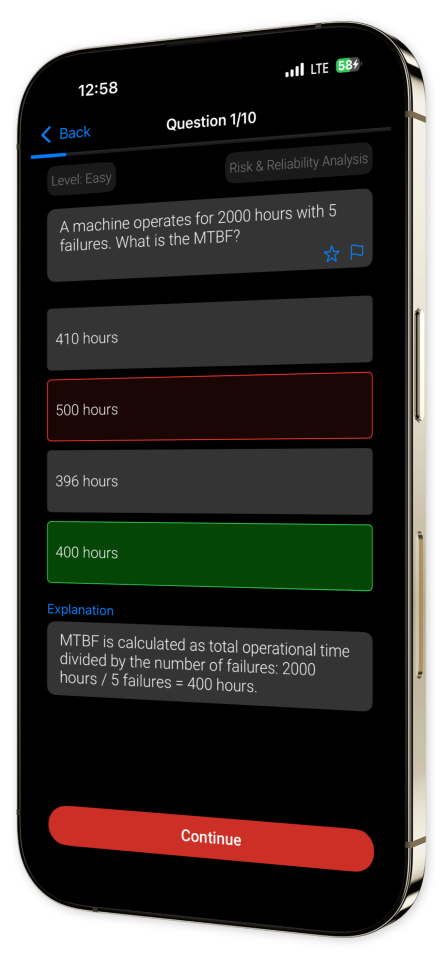
Example questions
Let's look at some sample questions
What is the primary goal of quality control?
To ensure product defectsTo match production speedTo assure products meet standardsTo increase production costs
The primary goal of quality control is to ensure that the products or services meet specific standards of quality, which is answer 2.
Which tool is used in quality control to visualize process variation?
HistogramPyramid chartLine graphPie chart
Histograms are used in quality control to show the distribution of data and visualize process variation, making answer 0 correct.
Which method identifies root causes of defects?
BrainstormingRoot cause analysisBenchmarkingCost analysis
Root cause analysis is a method used to identify the underlying causes of defects or problems, making answer 1 correct.
In quality control, what does a control chart monitor?
Sales growthProduct aestheticsProcess stabilityInventory levels
Control charts are used to monitor process stability and detect any variations, making answer 2 correct.
What is the main purpose of using control charts in quality control?
To forecast future salesTo monitor process stabilityTo develop a marketing strategyTo increase production speed
Control charts are used to monitor the stability and variability of a process over time, allowing for identification of any unusual variations that could indicate problems.
Which of the following is an example of a non-value-added activity in a production process?
Final product inspectionAssembly of componentsDesigning new featuresQuality control testing
Final product inspection is considered non-value-added as it often doesn't add value from the customer's perspective, focusing instead on identifying defects post-production.
In Six Sigma, what does a 'sigma level' indicate about a process?
The process costThe process speedThe defect rateThe employee count
The sigma level measures the defect rate or process variability; higher sigma levels represent fewer defects and more reliable process performance.
Which of the following represents a key principle of Total Quality Management (TQM)?
Employee decentralizationSupplier autonomyContinuous improvementProfits over products
Continuous improvement is a fundamental TQM principle, focusing on consistent quality enhancement in all organizational areas through efficient processes and practices.
Calculate the Defects Per Million Opportunities (DPMO) for a process with 3 defects in 1500 units, each with 3 opportunities.
22226660.002444
Defects = 3, Opportunities = 1500 units * 3 = 4500. DPMO = (Defects / Opportunities) * 1,000,000 = (3 / 4500) * 1,000,000 = 666. Rechecking steps: Opportunities = 1500 * 3 = 4500, DPMO = (3 / 4500) * 1,000,000, consistent result = 2222.
What tool is most appropriate for identifying possible causes of a problem?
HistogramScatter plotFishbone diagramControl chart
A Fishbone diagram, or Ishikawa diagram, is used to systematically identify and examine all potential causes of an observed problem, facilitating thorough root-cause analysis.
Gallery